
Geo-display platform for your mobility data
ALYCE publishes SaaS software that combines a business GIS with powerful statistical analysis tools. Designed by and for mobility and traffic engineering professionals, the MyGIS data visualisation platform meets the specific needs of cartographic modelling, the application of statistical models and the exploitation of data.
Intuitive and precise interface //
The information collected is centralised in a single tool, to save time in the regional analysis of travel.
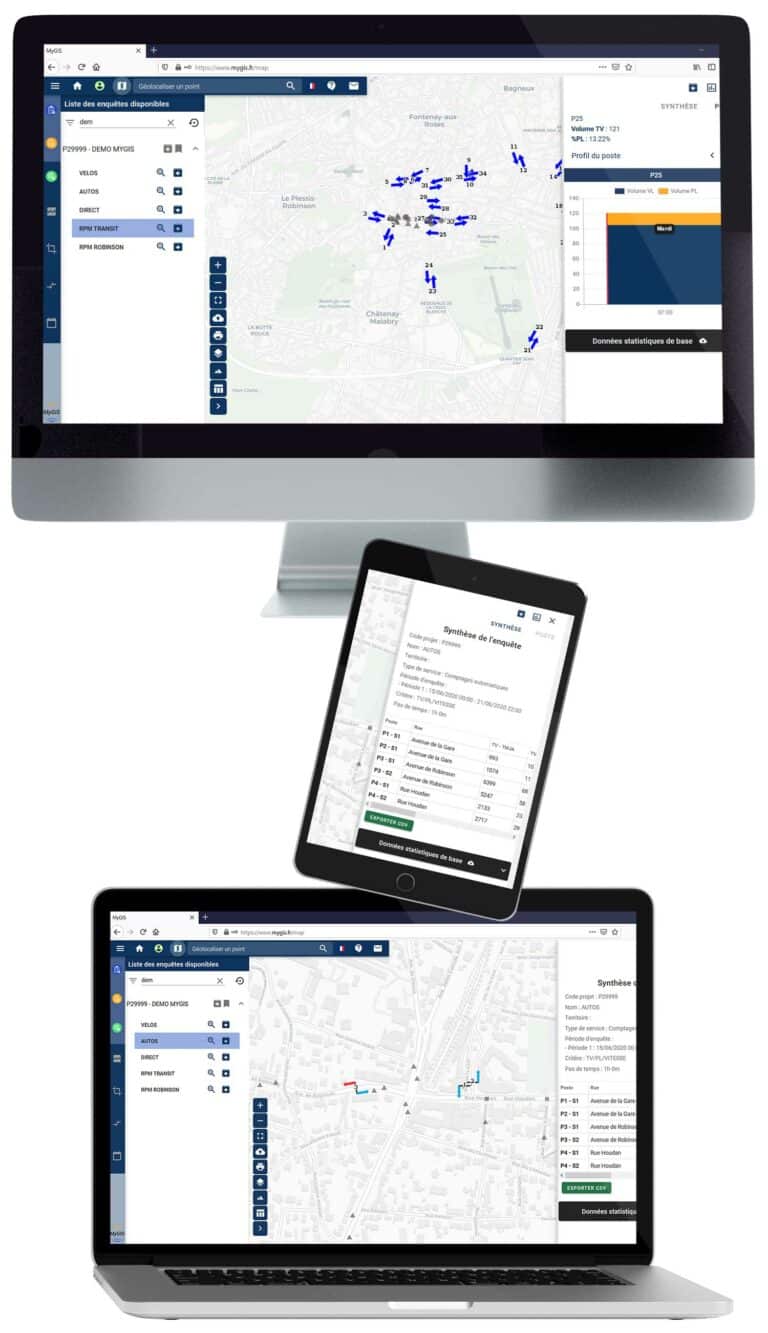
-
Modelling
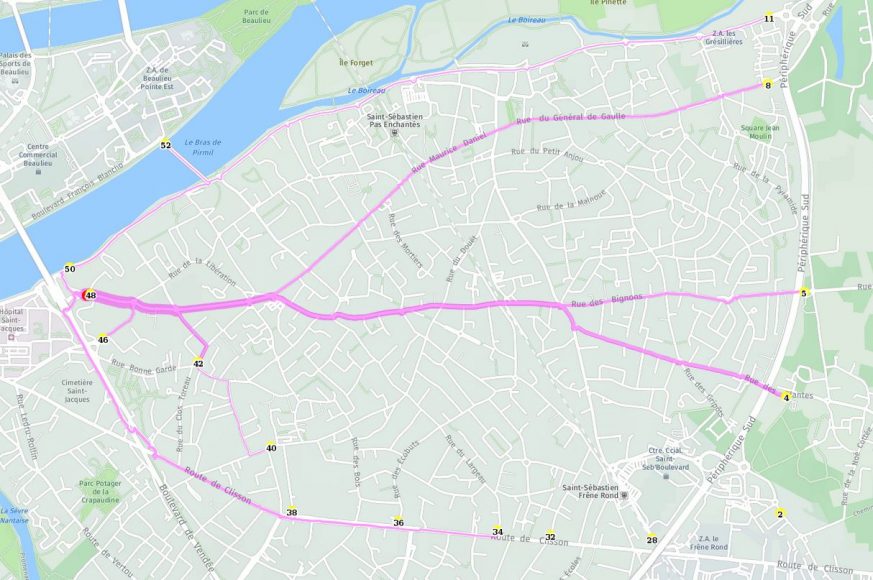
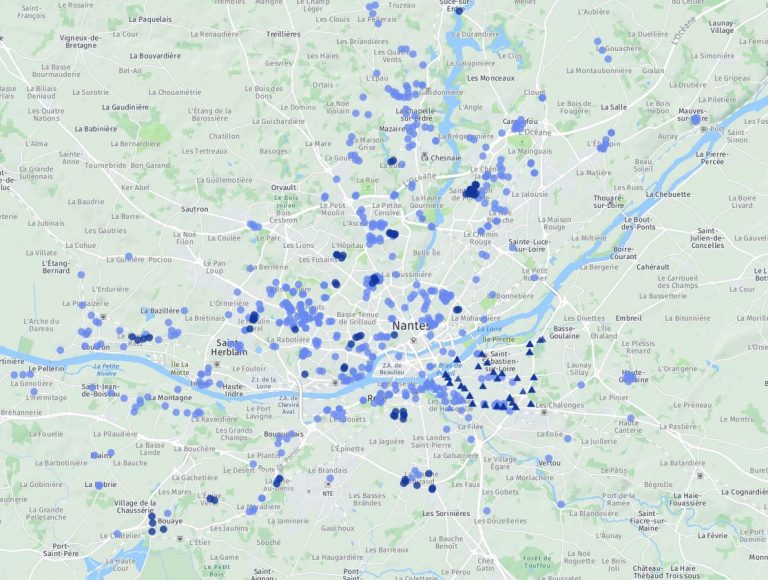
Visual statistics adapted to the representation of mobility data
Interactive maps
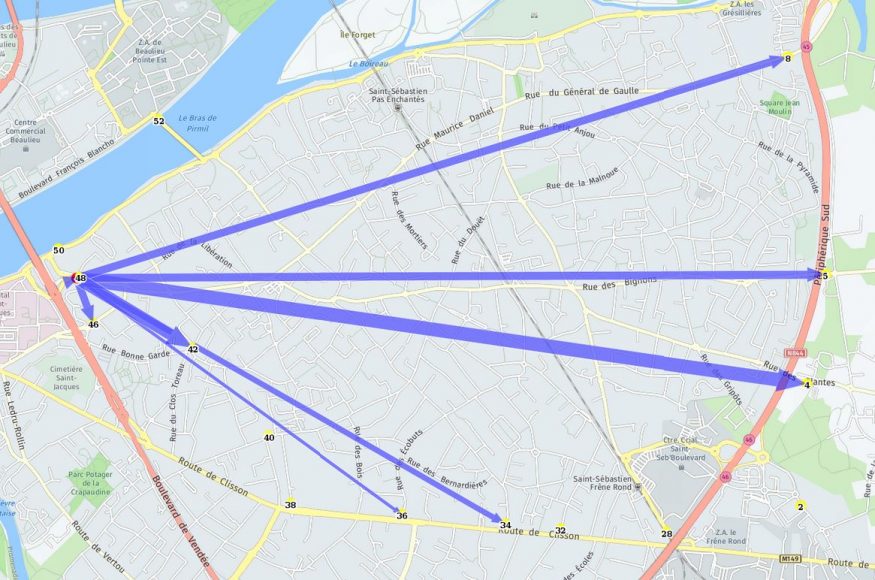
O/D analyses
Accessibility calculations
Isochronous maps -
Centralisation
Aggregated information with multi-source data input.
Traditional surveys and counts: road, public transport, EMC2
NICT data: FCD, GSM
Socio-demographic data
Open Data -
Powerful
Powerful and comprehensive analysis engine.
Ideal for conducting GIS studies with macros, data cross-referencing, advanced mobility and supply-side analysis, display of data from surveys and counts. -
Accessible
Thanks to the SaaS platform model, users can access their data from anywhere and from any type of terminal (computer, tablet, smartphone, etc.).
-
UX Design
The user experience has been designed to be smooth and simple so that anyone can get started quickly.
ALYCE makes your field data readable and accessible
Discover the platform’s features.
Rendering & modelling available //
They use MYGIS //


Want to save time processing your mobility data?
Find out how ALYCE can help you!

Julie Vegas
GIS expert
She has 10+ years of experience in GIS applied to Transport and now heads the software solutions department for data analysis and dataviz.
Let Julie’s advice guide you to create the dashboard(s) that will allow you to showcase your data!
